Dispatch Dashboard
The Dispatch Dashboard provides a comprehensive top-down view of fulfilment operations and performance.
The Solution
The dispatch dashboard provides a snapshot view of the various stages of processing and the items/orders requiring attention. This can be by individual dispatch point if these are used or an overview of all dispatch points.
Key Features
- It allows administrators to monitor order throughput, at the network, region, and store level
- The grid uses a traffic light system to help easily identify issues, and also allows the user to quickly review a specific fulfilment location and identify bottlenecks
- Continuous timeline support, coupled with sophisticated trend analysis and retrospective snapshot visualization, enable continuous process improvement
- Personalised reporting
Data
The dashboard shows the following data of work required to be completed as a total overview or by dispatch point:
- The number of items picked and waiting to be allocated to individual orders
- The number of orders to confirm the payment
- The number of orders waiting to print the packing slip
- The number of orders waiting to ship or complete the order processing and advise the customer the order is on its way
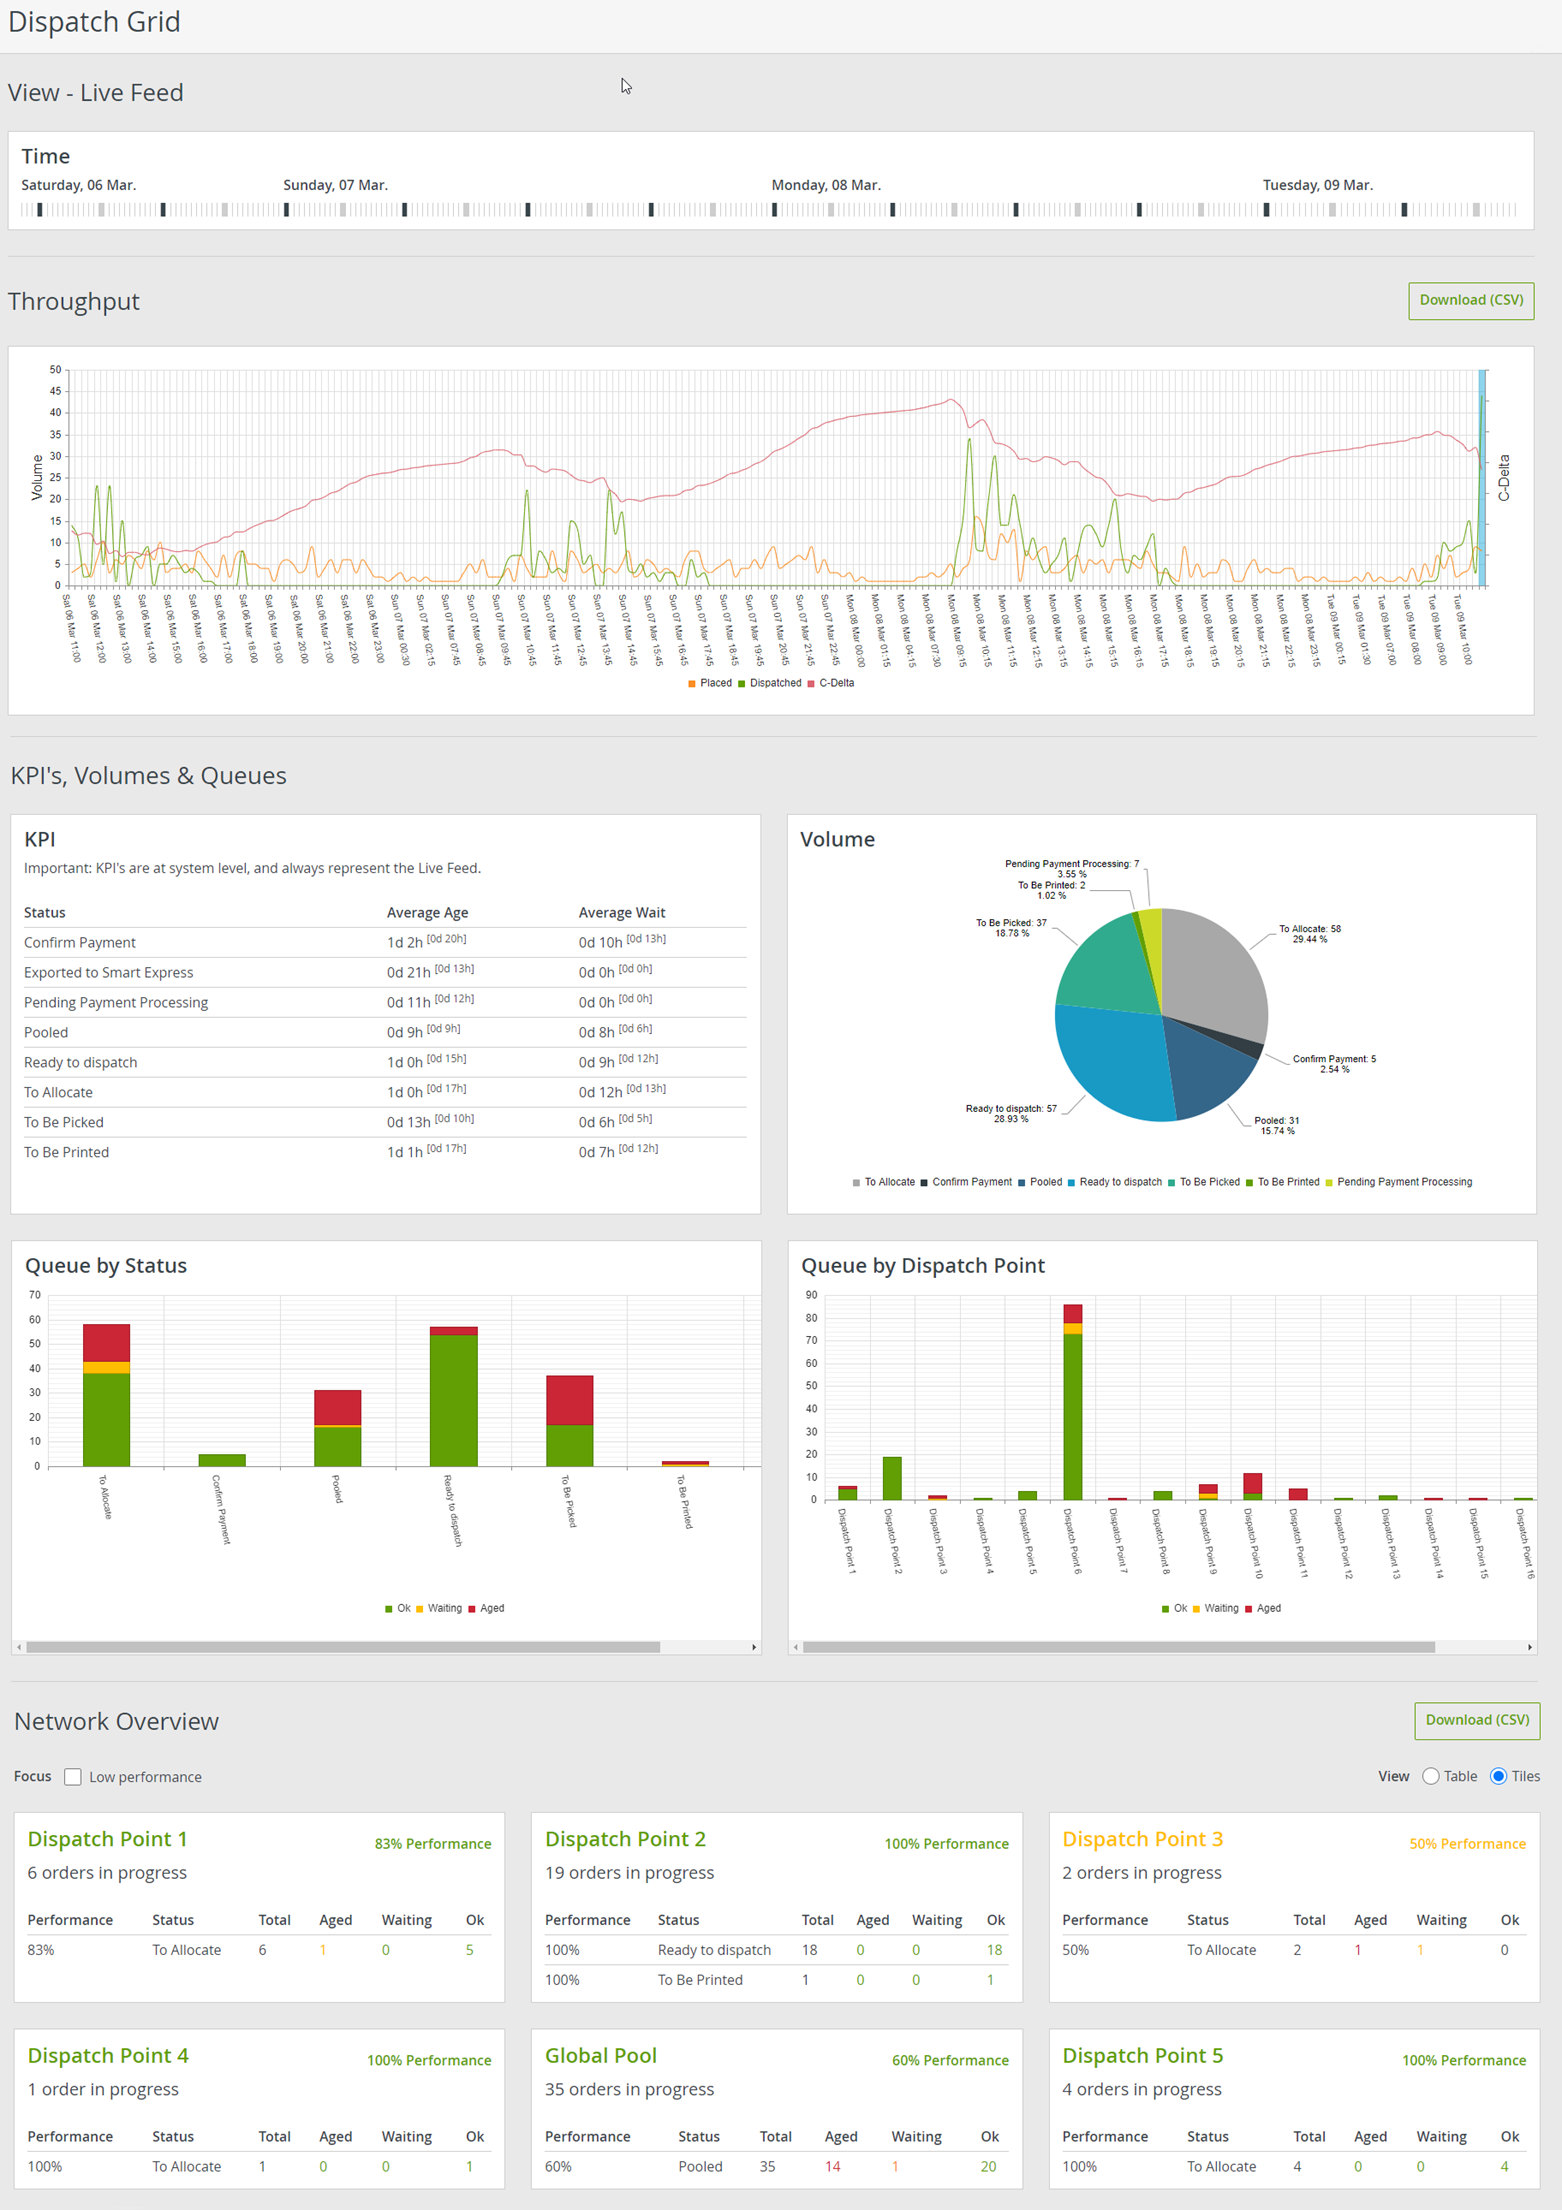
Figure 1 Sample Dispatch Grid Dashboard
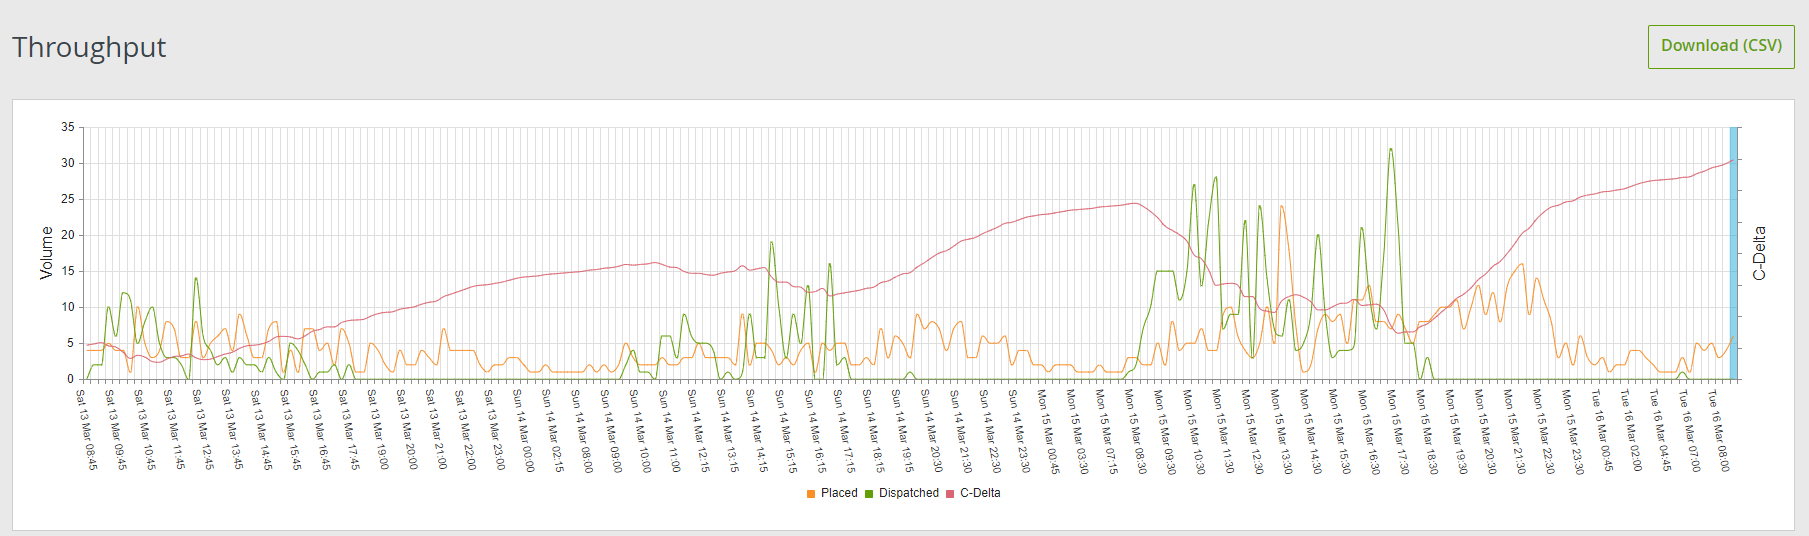
Figure 2 Sample Throughput Analysis Graph
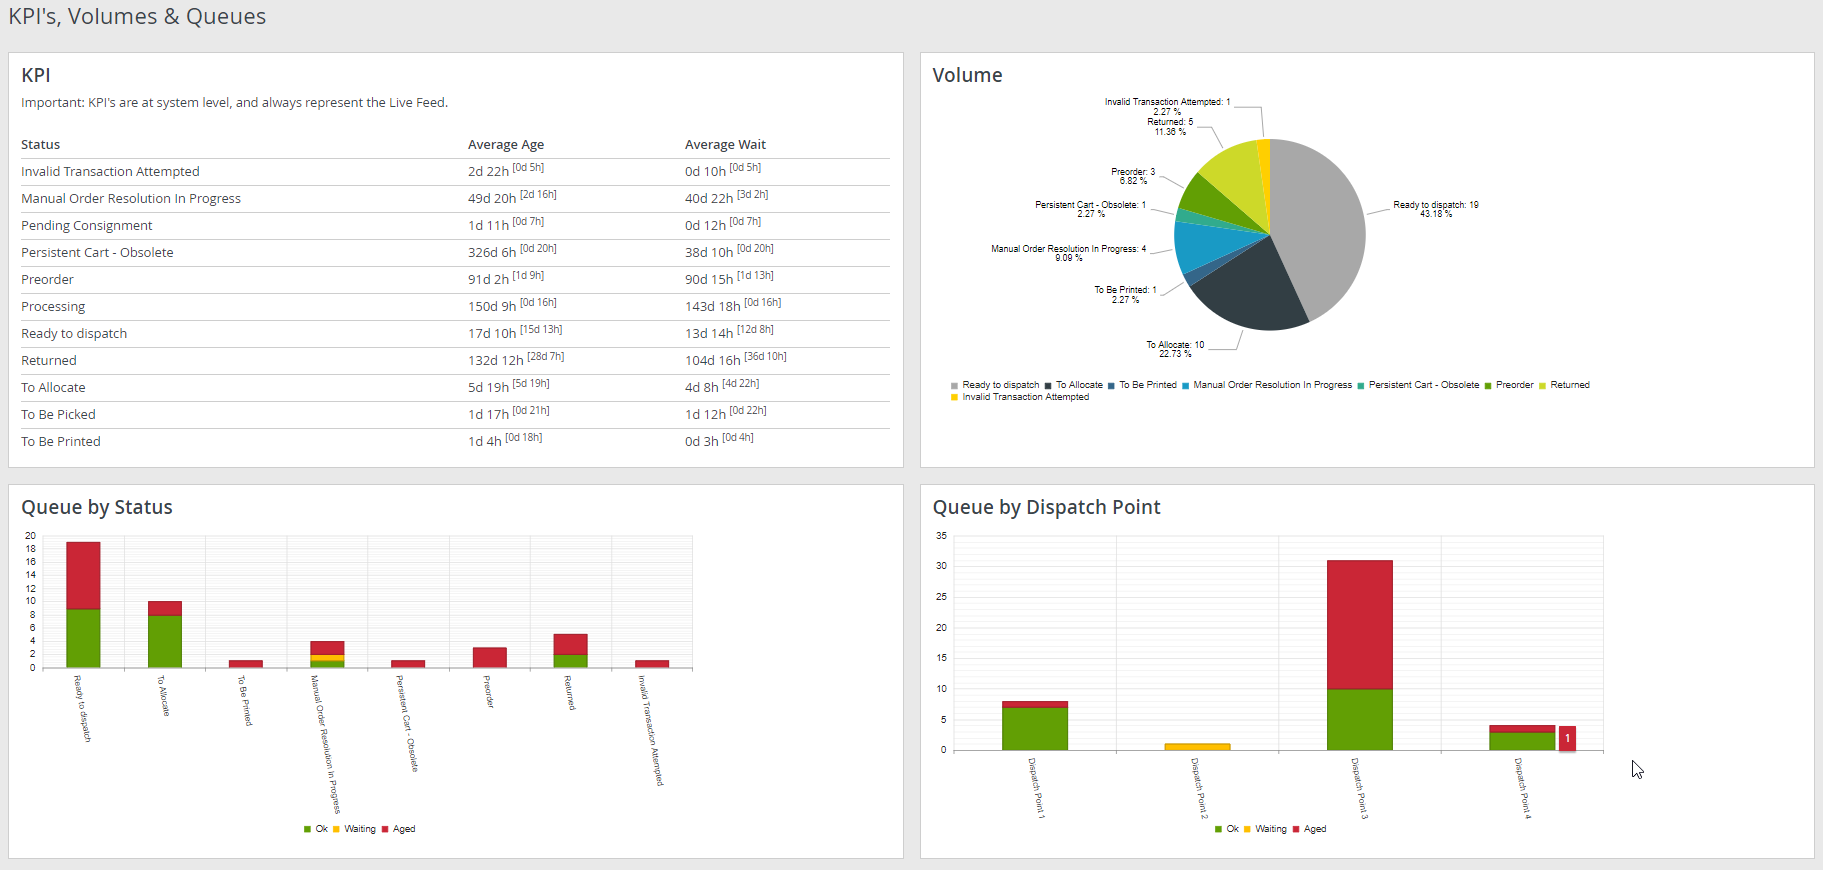
Figure 3 Sample KPIs. The bottom bar graph, for example, shows where the volume of orders is being processed at a given point in time, and condition of these orders.
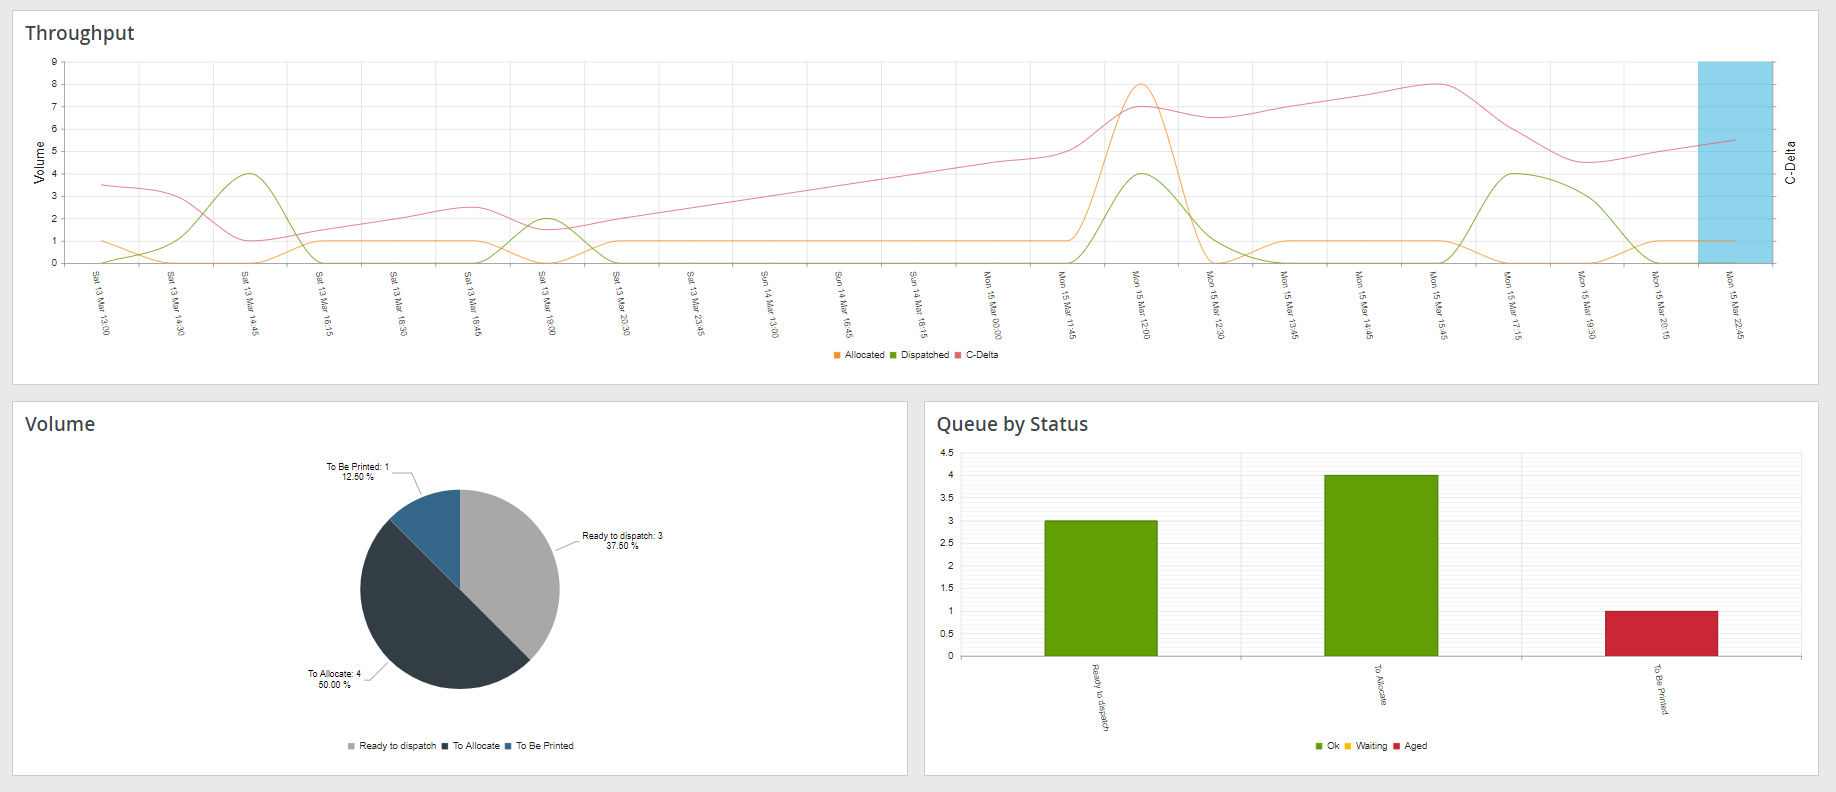
Figure 4 Drilldown report from the Bottom Bar Chart from Figure 3 to show the performance of a specific store in the network.
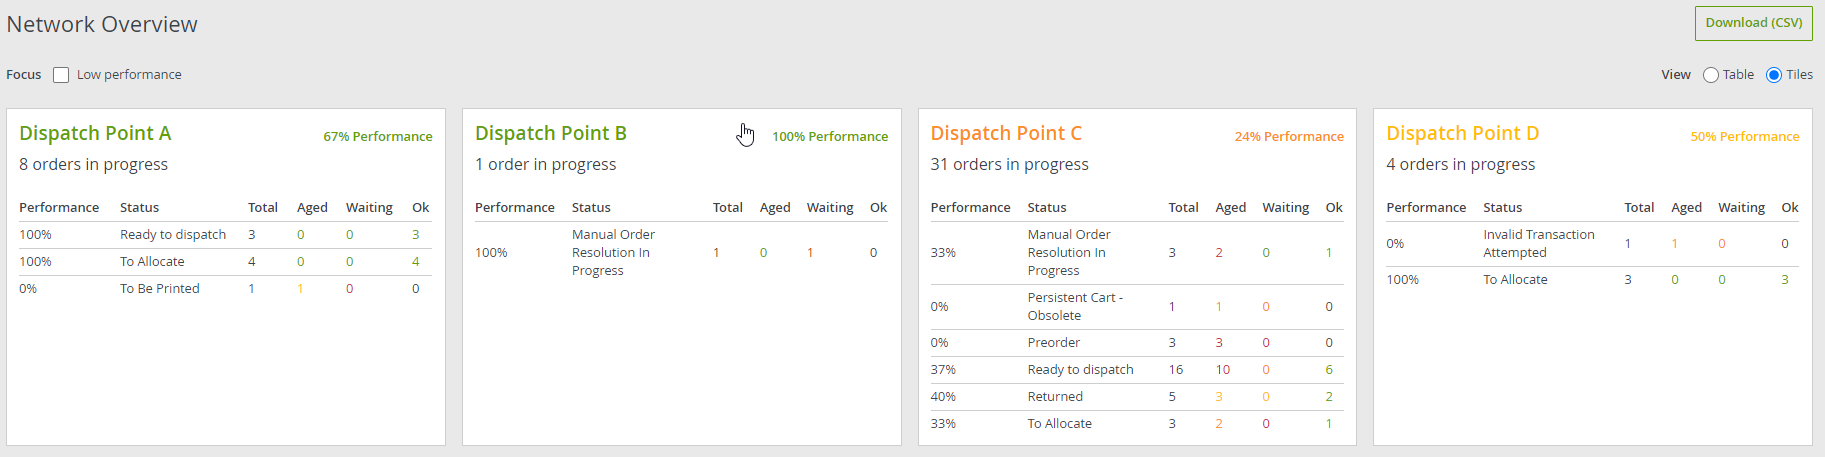
Figure 5 Sample Colour-Coded View of Each Store in the Network. Focus toggle allows the business to view the “problematic” stores in the network to identify where the issues lie.
Routing data can also be extracted using the Power BI connector to allow for deeper analysis.
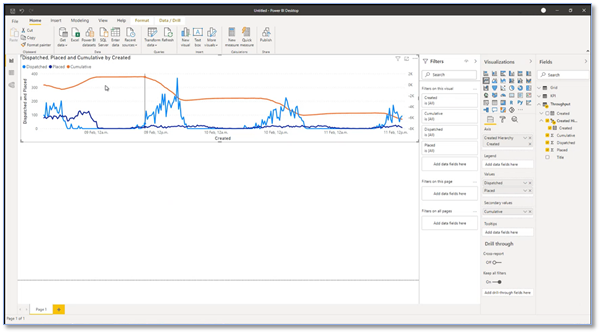
Figure 6 Power BI Connector. Sample report creation.